The Persian astronomer Abd al-Rahman al-Sufi recorded the Andromeda Galaxy as a ‘small cloud’ and the Large Magellanic Cloud, a small galaxy in the vicinity of the Milky Way, in his Book of Fixed Stars, in 964 AD. The western astronomers would start cataloguing galaxies in the 18th century, with the French astronomer Charles Messier compiling his famous list of 110 objects between 1774 and 1781. The catalogue numbers for these objects are still used in modern astronomy, with some famous examples being the Crab Nebula (M1), the Andromeda Galaxy (M31), the Triangulum Galaxy (M33), the Orion Nebula (M42), the Pleiades (M45) and the Whirlpool Galaxy (M51). He listed galaxies with star forming regions and star clusters, all fuzzy, cloud-like objects, without knowing their true nature. The German-British astronomer (and composer) William Herschel also began cataloguing diffuse objects in deep-sky surveys in the 1780s.
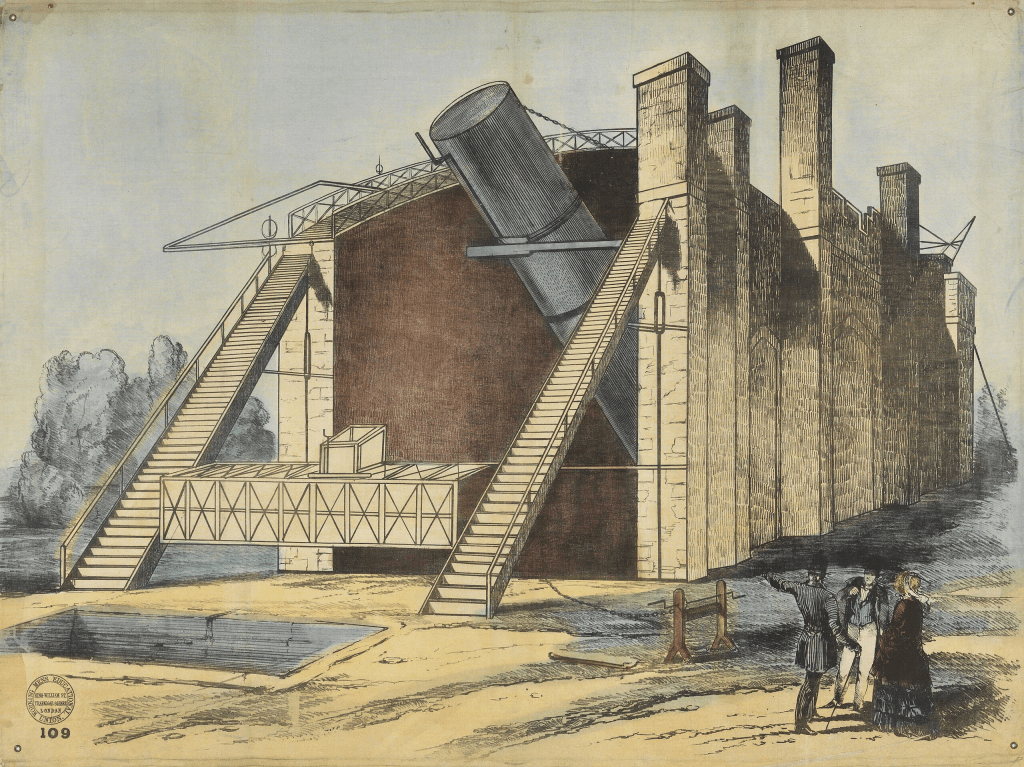
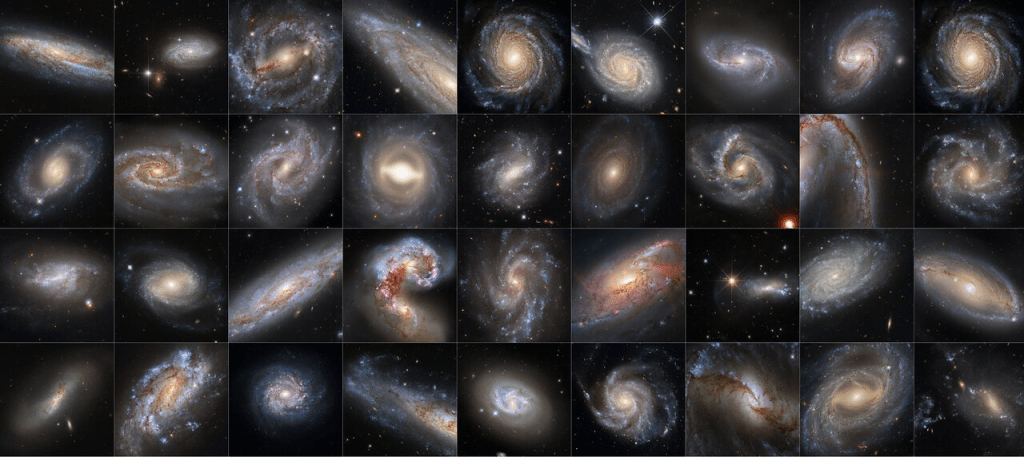
In the 1840s, the Irish astronomer William Parsons or Lord Rosse used his large telescope, dubbed the Leviathan of Parsonstown, to resolve the spiral structure in some of the Messier objects. He identified spiral arms in M51 first, followed by M99 and M33. These came to be known as spiral nebulae. Most astronomers viewed these spiral nebulae as gas clouds or star-forming regions inside the Milky Way. The prevailing view was that the Milky Way was the entire universe. Estimates of its size varied, but many thought it spanned tens of thousands of lightyears, and contained within it everything in the observable universe. There were some thinkers who dared to speculate otherwise. In 1755 itself, even before Messier began his catalogue, the German philosopher Immanuel Kant proposed that some nebulae might be ‘island universes’ independent systems of stars similar to the Milky Way. The primitive telescopes of his time were not powerful enough to test this hypothesis.
The Great Debate
In 1855, a bright nova erupted in the Andromeda Galaxy. Astronomers believed that Andromeda was at a great distance, which would mean an extraordinarily powerful nova. The British astronomer William Huggins, demonstrated a diversity among nebulae in the 1860s, using spectroscopic techniques. The Dutch-American astronomer Adriaan van Maanen claimed to have measured the proper motions or sideways movements of spiral nebulae such as M101 between 1916 and 1920. The detectable rotations indicated that these were small and close objects, not distant ones. These measurements would later prove to be erroneous.
Between 1917 and 1919, the American astronomer Harlow Shapley observed variable stars in globular clusters, known as RR Lyrae stars to determine that the Milky Way was about 300,000 lightyears across, with the Sun offset from the centre. We now know that the Milky Way 105,700 lightyears across. At that time, that galaxy seemed large enough to contain all the nebulae. This was however, a major shift from earlier estimates of a much smaller Milky Way centered around the Sun. The American astronomer Heber Curtis analysed novae in spiral nebulae observed between 1917 and 1919, and compared their luminosities to novae in the Milky Way. He argued that their faintness indicated tremendous distances, supporting the island universe theory.
The accumulating observations and interpretations created a divide in the astronomical community, leading to the Great Debate in 1920 between Shapely and Curtis at the US National Museum in Washington DC. Shapely argued that spiral nebulae were small objects within the Milky Way, that measured about 300,000 lightyears across. Curtis supported the island universe theory, claiming spiral nebulae were independent galaxies far outside the Milky Way, which he estimated measured about 30,000 lightyears across. Neither side won the debate at that time, but the issue was resolved a few years later when the American astronomer Edwin Hubble identified Cepheid variable stars in Andromeda between 1923 and 1924, confirming the existence of galaxies.
The Human Computer
It is necessary to rewind just a bit here. In the early 20th Century, the American astronomer Henrietta Swan Leavitt discovered the relation between period and luminosity of Cepheid variable stars. She was a ‘computer’, a role for women who analysed photographic plates. She examined thousands of images of the sky, and published a catalogue of 1,777 variable stars in the Magellanic Clouds in 1908. She identified 47 of these as Cepheids, a type of pulsating star named after the prototype, Delta Cephei. She demonstrated that the brighter variables tended to have longer periods. In 1912, she published research on 25 Cepheid variable stars in the Small Magellanic Cloud, which were all essentially the same distance from the Earth. The differences in their luminosities were directly related to intrinsic factors. By plotting the pulsation period against the brightness, Leavitt found a clear linear relationship. Brighter Cepheids had longer periods. This became known as the period-luminosity relation or Leavitt’s Law.
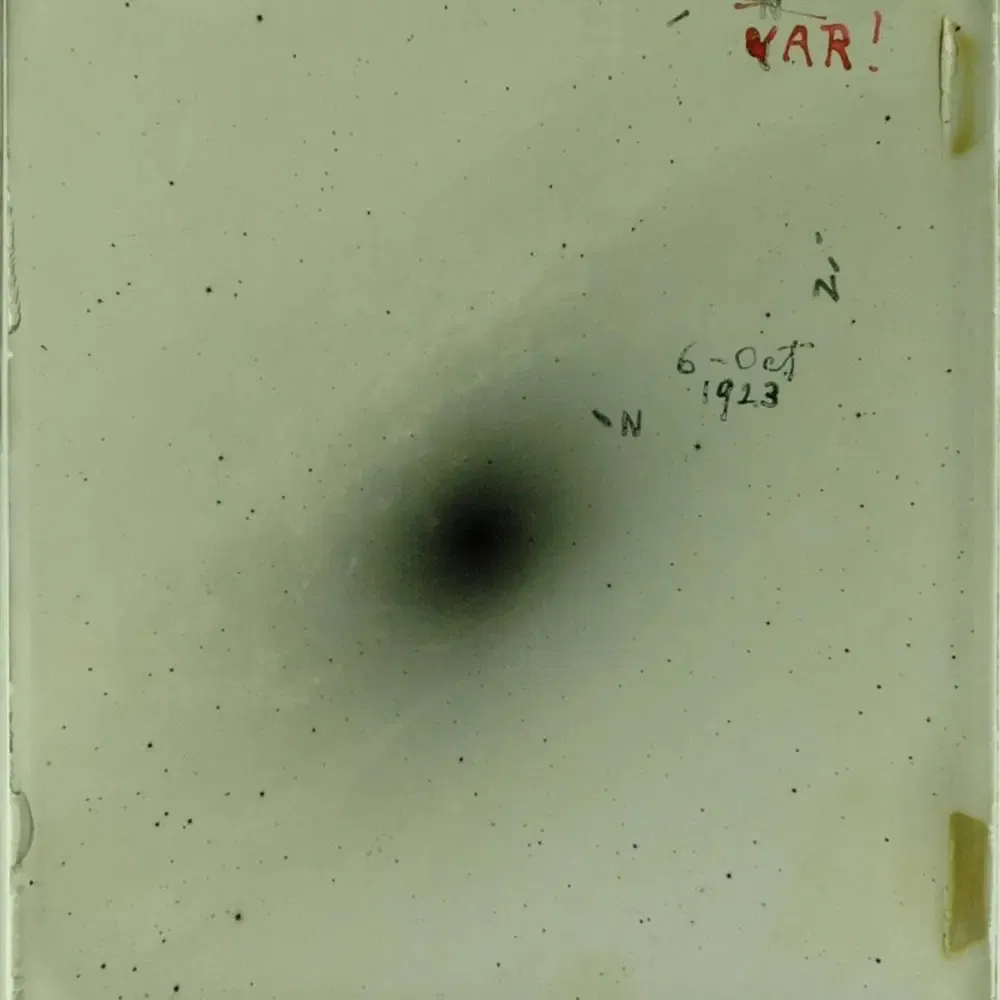
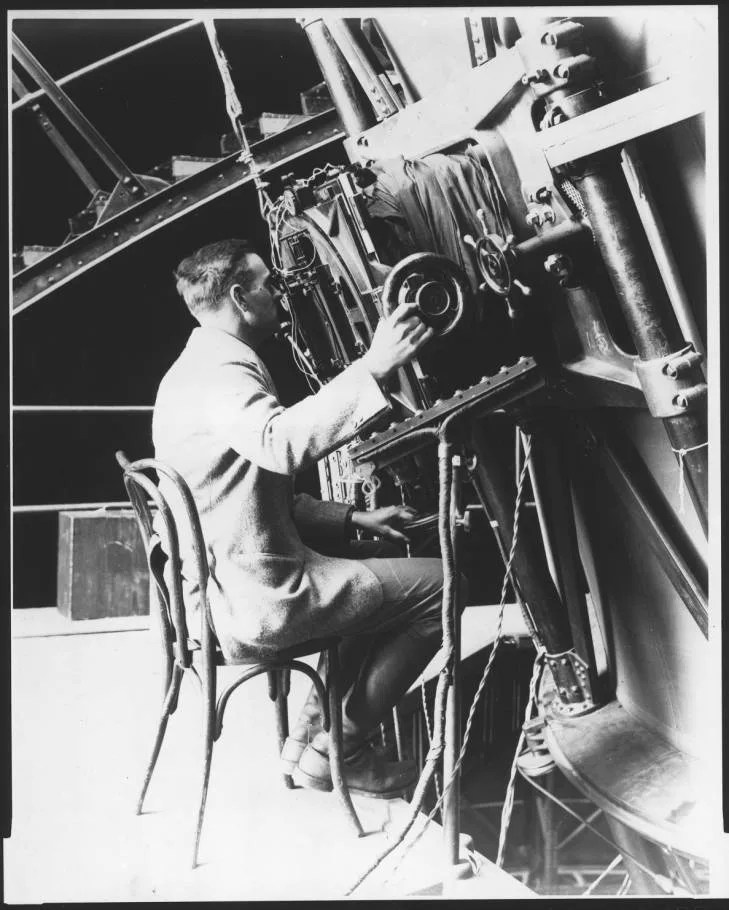
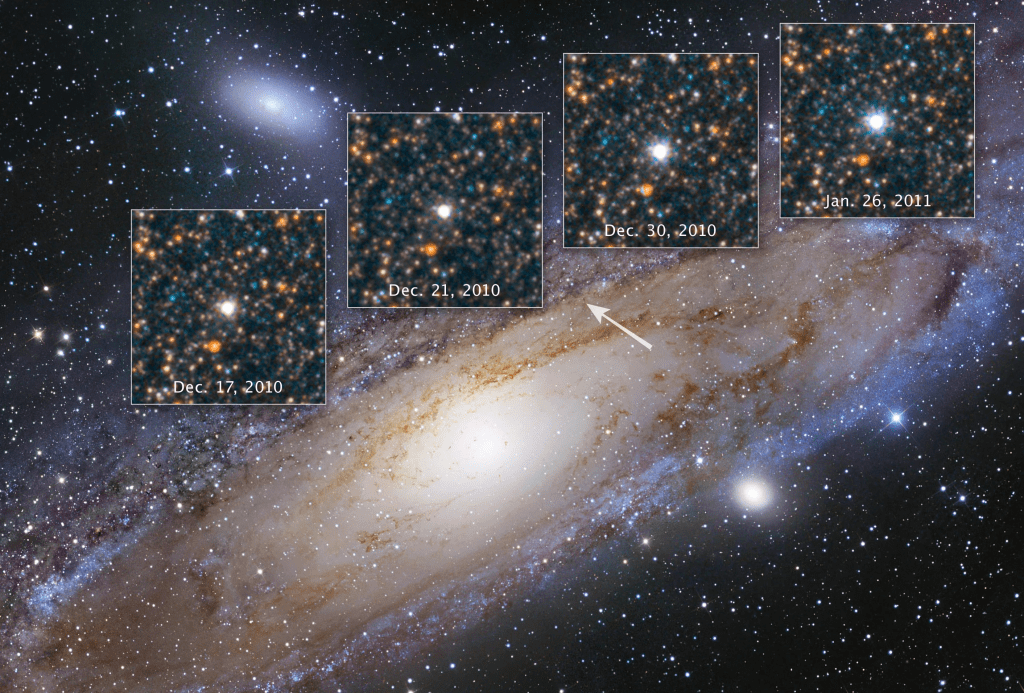
In late 1923, Edwin Hubble used the 100-inch Hooker telescope at mount Wilson Observatory to photograph the Andromeda Galaxy. At that time, it was the largest telescope in the world. On 6 October, he identified a star that had changed its brightness compared plates captured previously. This was a Cepheid variable star. Using Leavitt’s period-luminosity relation for Cepheids, Hubble was able to calculate its distance. He announced his findings in 1924, and presented them formally to the American Astronomical Society on 1 January, 1925. The distance to Andromeda, according to his calculations, was about one million lightyears, far beyond any reasonable size for the Milky Way. We now know that the actual value is 2.5 million lightyears. Hubble had proved that Andromeda and similar spiral nebulae were entire separate galaxies, not gas clouds inside ours. Humans have known about the very concept of galaxies for only a 100 years.
Hubble would go on to find Cepheid variable stars in the Triangulum Galaxy and NGC 6822, confirming the existence of multiple external galaxies. This discovery dramatically expanded the scale of the known universe, from one galaxy to billions, and laid the foundation for modern cosmology, including the phenomenon of cosmic expansion. Over the following decades, the word ‘galaxy’ would gradually replace the word ‘nebula’ to describe these fuzzy patches. Further, Hubble used his measurements of galaxies to demonstrate that the distant galaxies were moving away from us. The greater the distance to the galaxy, the faster it runs away. This came to be known as Hubble’s Law, and is formally stated as ‘the speed at which galaxies recede from Earth is directly proportional to their distance’.
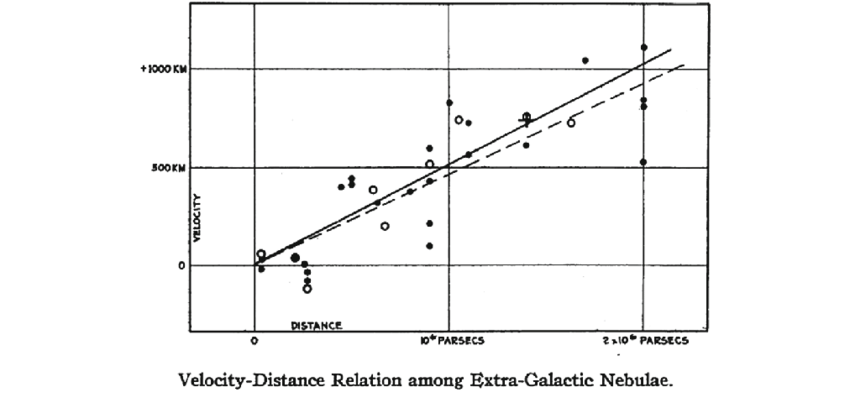
Scientists realised that the universe is expanding. The rate of expansion is known as the Hubble Constant. In 1929, Hubble plotted the velocity of galaxies based on the redshift, against the distances based on Cepheid variable stars, for 24 galaxies. He discovered that they fell along a line that could be considered more-or-less straight, with the velocity equal to a constant multiplied by distance. The mathematical formulation for Hubble’s law is v = H0 * d, where H0 is the Hubble Constant. Hubble measured this to be about 500 km/s per megaparsec in his data. His value was too high because the distances were underestimated. Later corrections brought it down, but the discovery transformed cosmology. Humans understood that the galaxies are carried apart by the continuous expansion of space. The true value of the Hubble Constant has not yet been determined accurately.
The Cosmic Distance Ladder
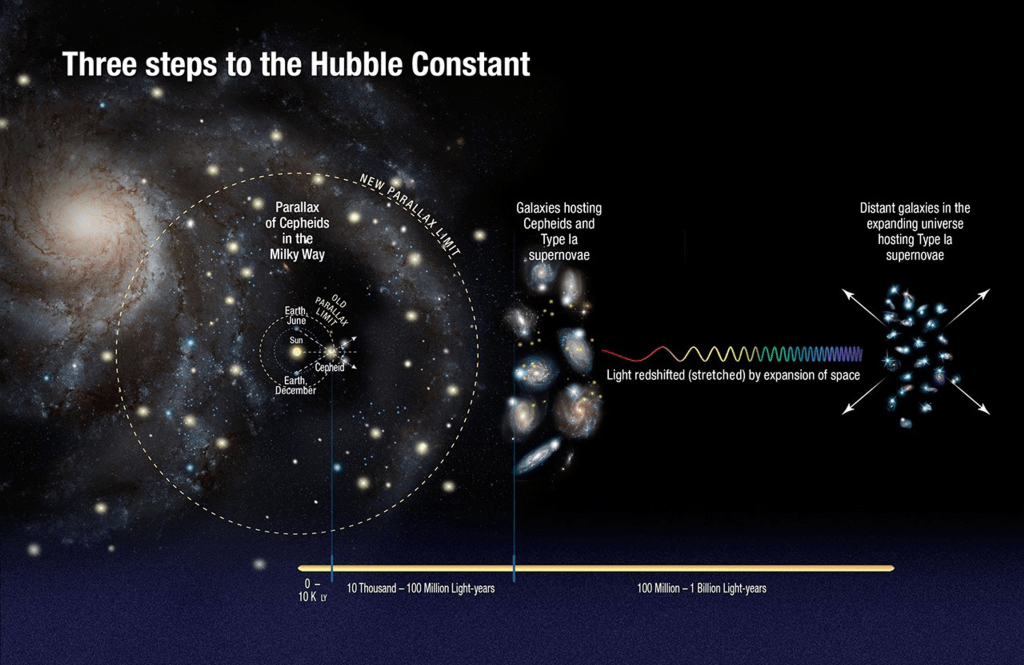
To measure the rate at which the universe is expanding, it is necessary to accurately determine the distances to distant astronomical objects. Doing this is easier said than done. The exercise is comparable to eyeballing the distance to a city on the ground from a aeroplane flying overhead, at night. There is no context, or frame of reference to judge the distance with any degree of accuracy. A galaxy suspended in the inky blackness of space poses the same challenge. Astronomers use a series of steps, called the cosmic distance ladder, with each step calibrating the next, for more distant objects.
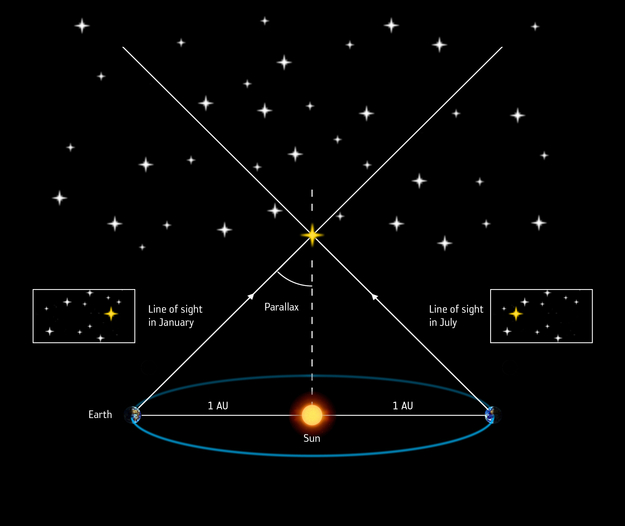
The first rung in the cosmic distance ladder is parallax. For the nearby stars, the orbit of the Earth around the Sun makes them appear to shift slightly against background stars. This angle of the shift provides the distance. The Gaia telescope measures parallax for billions of stars out to thousands of light-years. The next rung are Cepheid variable stars. The period-luminosity relation established by Leavitt allows us to determine the true brightness from the pulsation period. Hubble used them to measure distances to nearby galaxies. Today, we observe Cepheid variable stars in galaxies up to a distance of 100 million lightyears.
Standard Candles
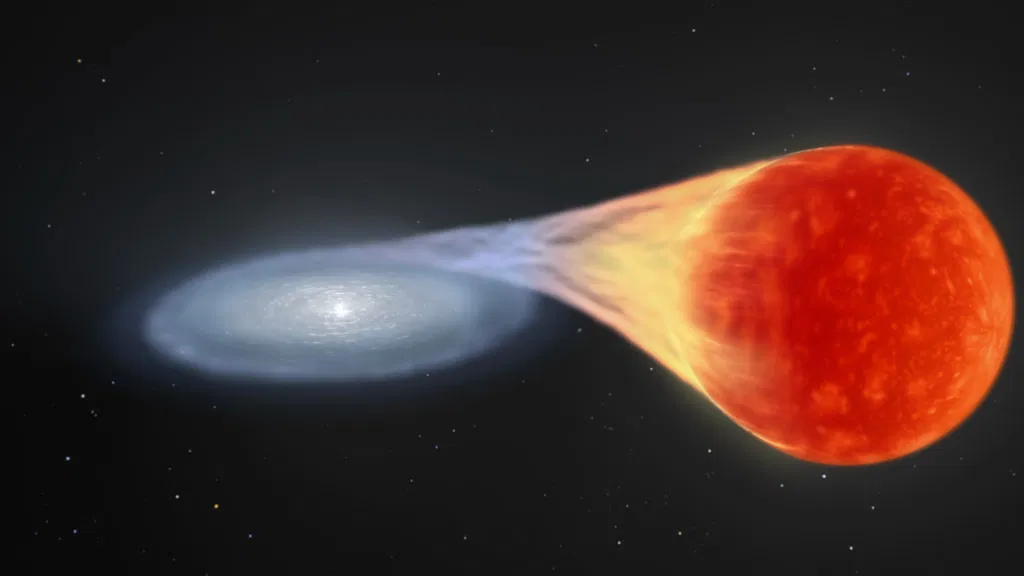
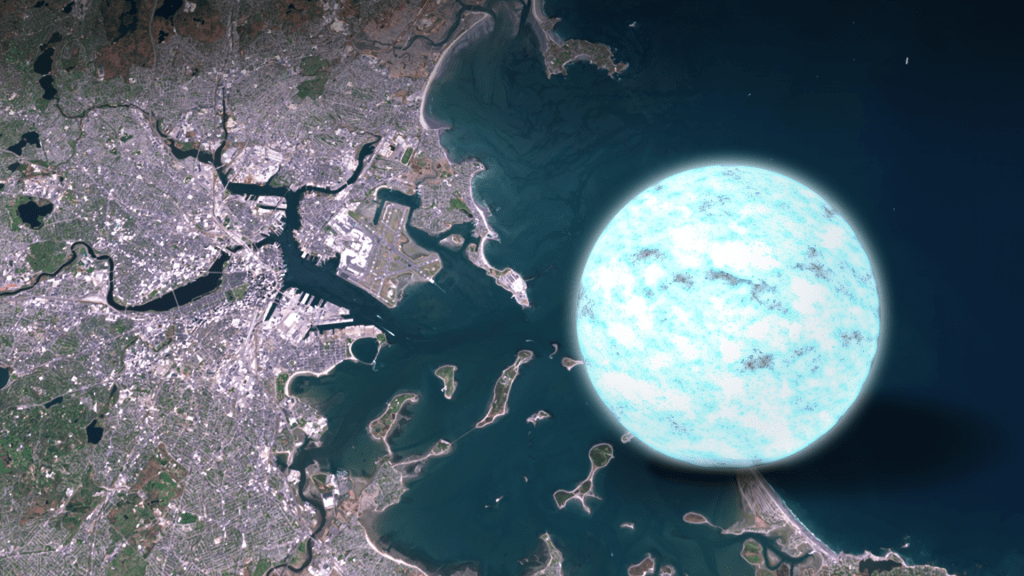
The luminosities of Type Ia supernovae are well understood based on theory. These occur in binary systems, where one low-mass star like the Sun has ran out of nuclear fuel and violently exploded, leaving behind a dense core known as a white dwarf. This white dwarf star vampirically feeds on the outer atmosphere of a binary companion. The accumulated material is violently shed in a thermonuclear detonation when the mass reaches a critical limit. These stars keep exploding repeatedly, and have a similar peak in luminosity. Collisions between a pair of white dwarfs can also produce Ia supernovae. The luminosities of the Type Ia supernovae are calibrated using the Cepheids in the same galaxies. Type Ia supernovae are used to determine distances of galaxies out to billions of lightyears.
Both Cepheid variable stars and Type Ia supernovae are ‘standard candles’, well-characterised objects of known luminosities that can be used as cosmic milestone markers. The inverse-square law of light, where the brightness falls off predictably with distance, is used to measure the vast distances of space. Scientists also use Tip of the Reg Giant Branch (TRGB) stars, or low-mass red giants that are in their final stages of stellar evolution as standard candles. These are used in galaxies with old stellar populations where Cepheid variables are scarce, and is an independent standard candle that is used to cross-check measurements based on Cepheids. Also megamasers in certain edge-on galaxies allows for exquisitely precise, purely geometric measurements of distance, and is primarily used to anchor the distances to nearby galaxies within tens of millions of lightyears.
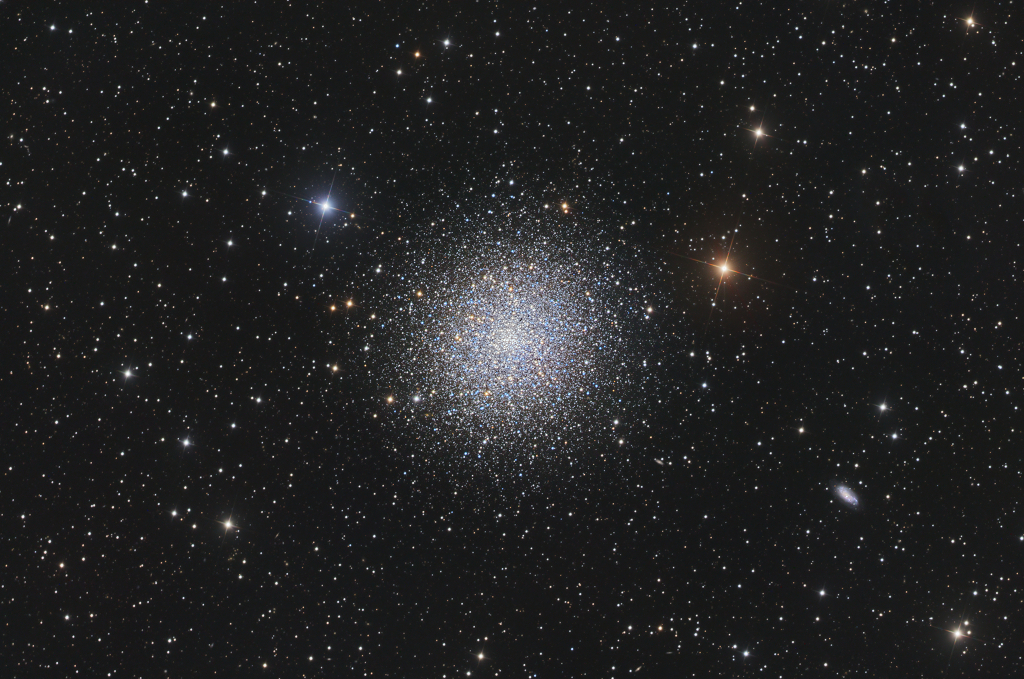
RR Lyrae Variables, or pulsating stars in globular clusters are used to measure distances within the Milky Way and nearby galaxies. Mira Variables, that are long-period pulsating giants are used as a standard candle in galaxies at intermediate distances. Pixel-to-pixel variation in galaxy images from unresolved stars, called Surface Brightness Fluctuations are used in galaxies up to 100 million lightyears away. Many of these methods overlap and provide cross-checks. For example, the TRGB stars and megamasers both allow determining distances to galaxies without relying on Cepheid variable stars. The cosmic distance ladder is bult step by step, with nearby objects serving to calibrate those at intermediate distances, which are then used for more distant objects. Errors can easily propagate in such approaches, which is why multiple methods are used to cross-check. Scientists using Type Ia supernovae to measure the rate of expansion of the universe, would discover something remarkable.
Accelerating Expansion
The standard cosmological models based on general relativity predicted that the gravitational influence of matter would slow the expansion down over time. Scientists assumed that the tremendous energy of the Big Bang was responsible for the expansion of the universe, first observed by Hubble, which would slow down as the universe aged. The key question was the rate at which this expansion was decelerating. Precisely measuring this would reveal the overall density of matter in the universe, as well as its eventual fate, whether it would expand forever, collapse in a Big Crunch, or reach equilibrium.
In 1988, Saul Perlmutter at Lawrence Berkeley National Laboratory began the Supernova Cosmology Project (SCP), leading a team that developed techniques to investigate distant Type Ia supernovae to test cosmological models. The initiative focused on discovering a large number of supernovae at high redshifts. Scientists from the Australian National University, led by Brian Schmidt started a similar effort in 1994, called the High-Z Supernova Search Team. The High-Z here stands for high redshift. This team emphasised rapid follow-up observations and refined calibration of supernova light curves. Adam Reiss would play a critical role in the work of this team. Both teams chose to work with Type Ia supernovae because of the remarkably consistent peak luminosities. The teams worked independently and competitively, searching wide fields for supernovae, then conducting follow-up photometric and spectroscopic observations to confirm candidates.
To measure the assumed deceleration of the expansion of the universe, both the teams plotted the distance or magnitude of the supernovae against their redshifts. In a decelerating universe, distant supernovae should appear brighter than a coasting or empty universe because expansion slowed in the past, so objects reached their current distances more quickly. Both teams found the opposite, the distant supernovae were dimmer than expected for any model with deceleration. The observations revealed something unexpected and dramatic. Instead of slowing down, the expansion of the universe was accelerating. The SCP as well as the High-Z team announced their results in 1998. There was total surprise in the scientific community. Both teams had set out to quantify deceleration, and had instead discovered acceleration. Systematic errors were checked extensively and ruled out as explanation.
The Greatest Blunder
The discovery that the expansion of the universe was accelerating was supported by independent methods. In 2011, the Nobel Prize in Physics were awarded to Saul Perlmutter, Brian P Schmidt and Adam G Riess, ‘for the discovery of the accelerating expansion of the Universe through observations of distant supernovae’. In 1917, Albert Einstein had added a Cosmological Constant denoted by the Greek letter lambda (Λ) into his field equations of general relativity, to represent the constant energy density associated with empty space, producing a repulsive gravitational effect that pushes things apart. The constant was added to force his equations to a static universe, at a time when nearly all astronomers and physicists believed that the universe was static and eternal, unchanging even on the largest scales.
Once Hubble demonstrated that the galaxies were receding, Einstein was quick to drop the cosmological constant, calling it his ‘greatest blunder’. He regretted introducing an arbitrary fudge factor to preserve an outdated assumption. Cosmologists however, would continue to set Λ=0 in models. Once scientists discovered that the expansion of the universe was accelerating, the simplest explanation was a positive cosmological constant. Set Λ>0 and the observed universe matched the theoretical models. Λ turned out to be a convenient explanation to the acceleration observed in the expanding universe, and behaves as dark energy, that is inherent to space and drives acceleration.
Today, the standard model of cosmology is called ΛCDM, for Lambda Cold Dark Matter. The cold here refers to the velocity of dark matter particles in the early universe, and not their temperatures. The ΛCDM model describes that the 68 per cent of the universe is dark energy, in the form of the cosmological constant Λ. Cold dark matter makes up about 27 per cent, with the ordinary baryonic matter, or everything that we can see, making up just five per cent of the universe. There is a negligible amount of radiation as well. This model successfully explains the cosmic microwave background (CMB), the large-scale structure of galaxies, and the accelerating expansion of the universe. A major challenge to the ΛCDM model however, is the Hubble Tension.
Beyond known physics
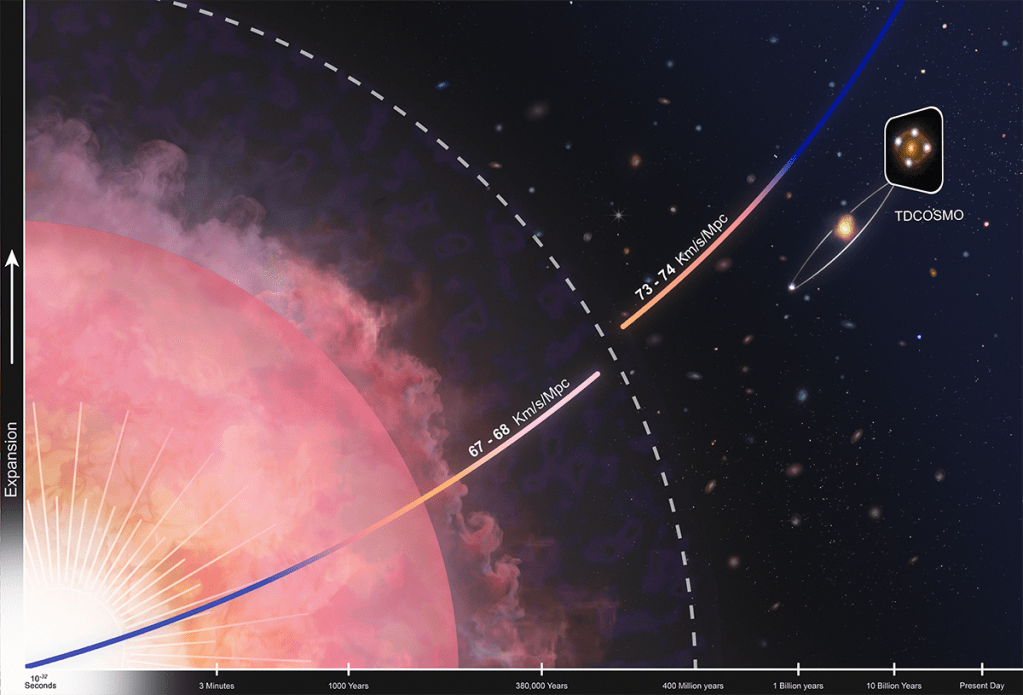
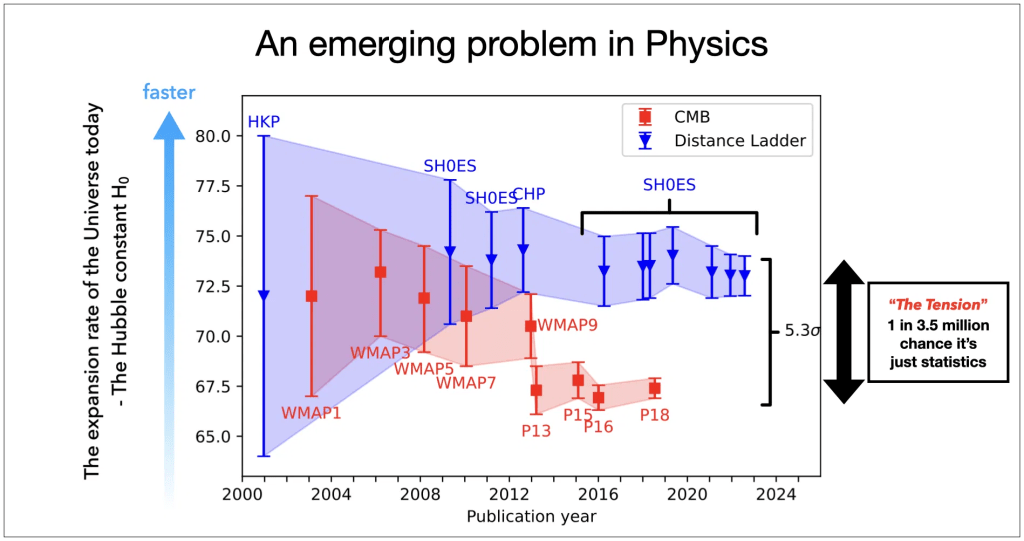
The Hubble Constant is a physical quantity that measures the rate at which the universe is expanding right now. Scientists are attempting to pin this value down. The Cosmological Constant explains why the expansion of the universe is speeding up instead of slowing down. The Hubble Tension is a major challenge to the ΛCDM model, and refers to a statistically significant discrepancy in the measurement of the current expansion rate of the universe. Early universe measurements inferred from the CDM yields a value of about 67.4 ± 0.5 km/s/Mpc. Local universe measurements using Cepheid variables, TRGB stars and Type Ia supernovae all have a value of around 73–74 km/s/Mpc. This difference of eight to nine per cent has now been measured with a certainty of over five sigma, which means it is very unlikely to be a random error.
There are two possible explanations. Systematic errors in one or both measurement chains is still possible, but increasingly constrained. The other possibility is that the ΛCDM is incomplete, and is missing physics from the early universe, or in the late universe. It is possible that the mysterious dark matter evolves with time. The Hubble tension itself is a direct test of the predictive power of the ΛCDM model across cosmic time. While there were disagreements in the value of the Hubble Constant for decades, these were merely large uncertainties, without the tension. The Hubble Tension in its modern form emerged with precise, model-independent constraints of the early universe derived from the observations of the Planck satellite launched in 2009.
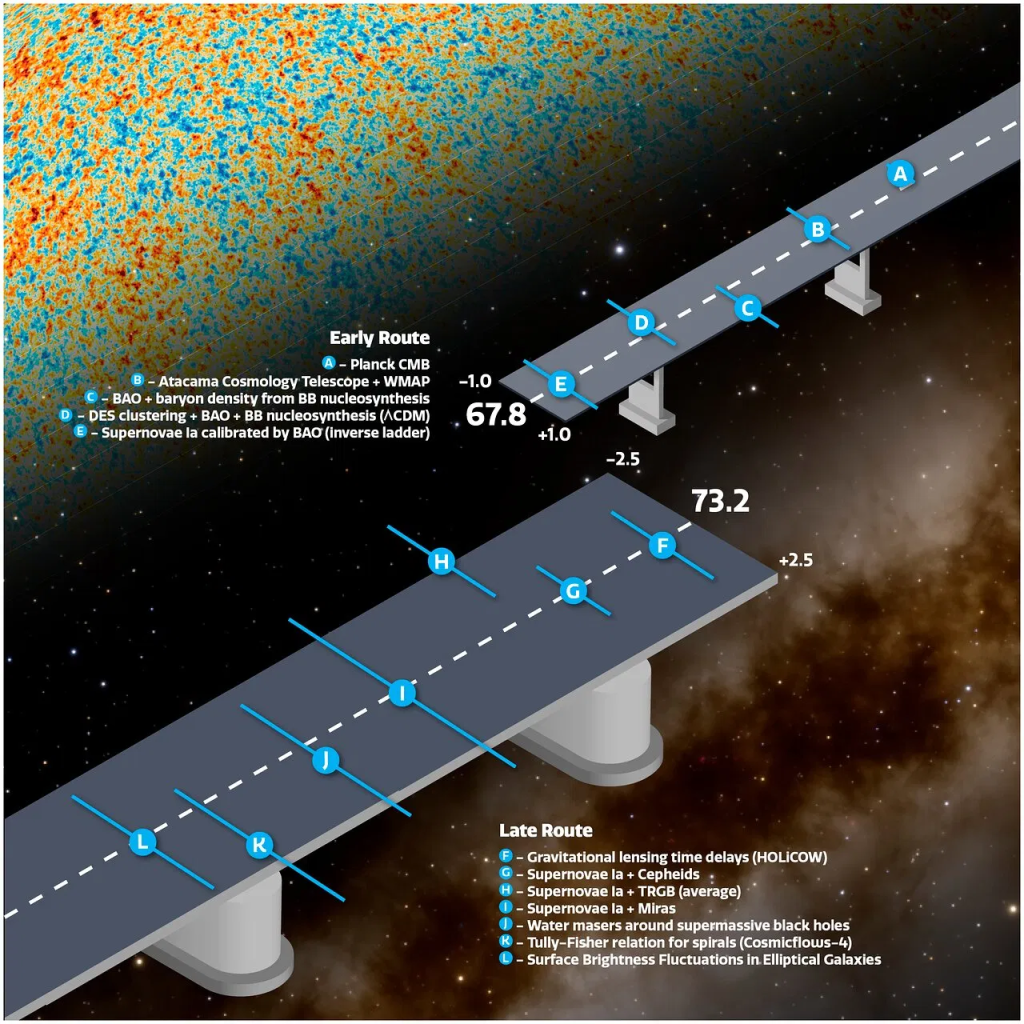
The first data release in 2013 mapped the CMB in unprecedented detail. When reconciled or ‘fitted’ into the ΛCDM model, the Hubble constant was determined to be 67.8 ± 0.8 km/s/Mpc. This was much lower and more precise than the many estimates from that time based on observations of the local universe, including measurements derived from observations of Type Ia supernovae and Cepheid variable stars. The tight constraints of Plank crashed with improving local ladders, such as Cepheid calibrations by Hubble. In 2016, Adam Reiss and the SH0ES team reported a value of 73.2 km/s/Mpc with no overlap in error bars with Planck’s value. Papers and reviews began highlighting this as a potential problem. The Hubble Tension is now one of the biggest open questions in cosmology, with new physics beyond the ΛCDM model being the most likely explanation.
Resolving the Hubble Tension
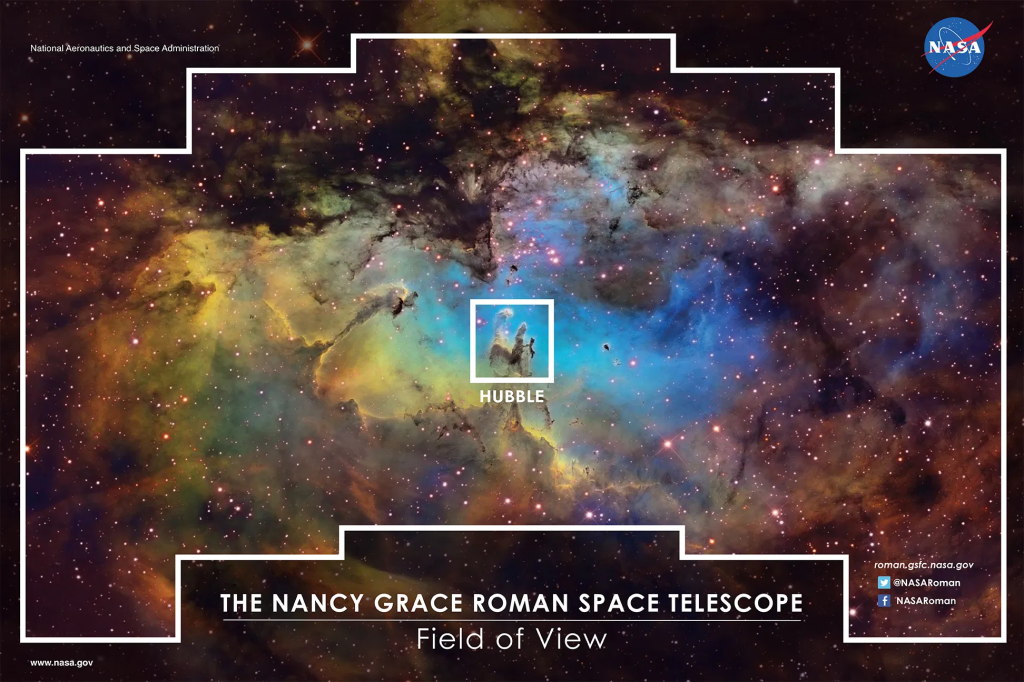
There are a number of instruments that may be able to help resolve the discrepancy. The Dark Energy Spectroscopic Instrument (DESI) has embarked on a five year study to create the largest three-dimensional map of the universe. Only 10 per cent of this survey has been completed, with the instrument expected to map 35 million galaxy by the end. The James Webb Space Telescope can observe standard candles with much more precision than the Hubble Space Telescope, and there are multiple ongoing programmes aimed at resolving the Hubble Tension. The Roman Space Telescope, slotted for launch in 2027 has a field of view 100 times that of Hubble. The Vera C Rubin Observatory in Chile, that officially began operations in 2025 will also conduct a comprehensive survey. Gravitational wave detectors such as VIRGO, LIGO and KAGRA can help improve estimates for the early universe and refine models.
Astronomers are also using a number of innovative new techniques to measure the Hubble Constant. One of these is known as time-delay cosmography, and uses gravitational lenses, where a foreground object warps and distorts the light from a background object, creating multiple ‘mirror’ images. By measuring the time difference it takes for changes in the background objects to all the mirror images, extremely large cosmic distances can be measured, and subsequently the Hubble Constant as well. The value derived from such measurements is close to the value derived from observations of the local universe.
Cosmological Coupling
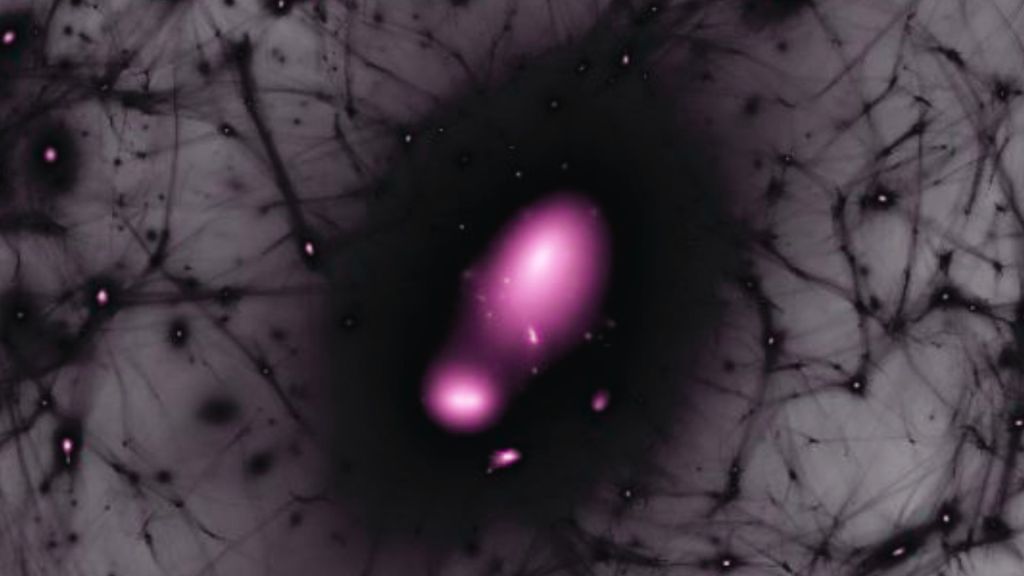
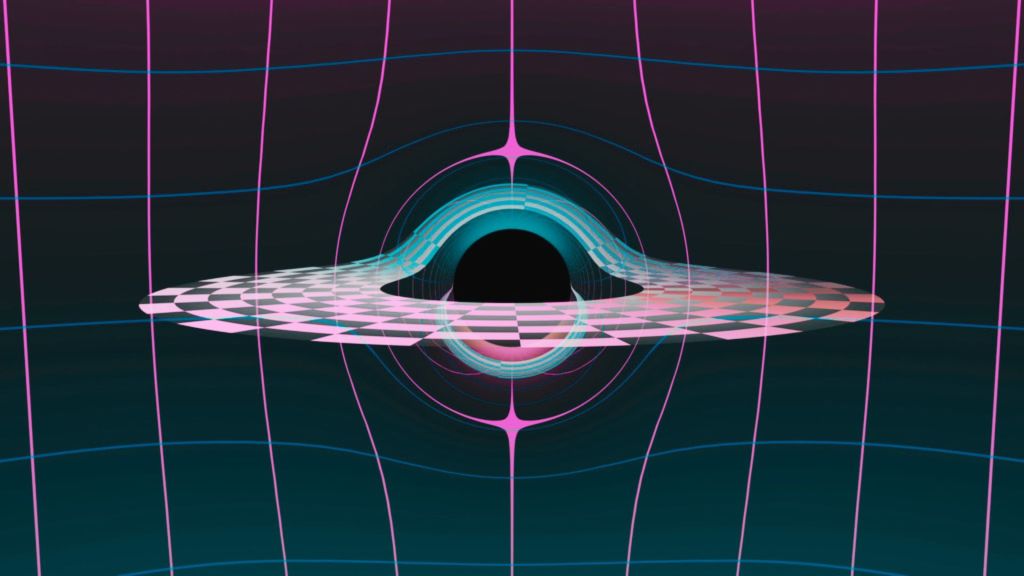
Cosmological Coupling refers to the idea that certain objects with strong gravity, especially black holes, can interact directly with the large-scale expansion of the universe. This coupling means that the effective mass of the black hole grows as the universe expands, without needing to swallow additional matter or merge with other objects. The most provocative claim associated with Cosmological Coupling is that black holes themselves are the somehow linked to dark energy. While the idea does not have mainstream consensus yet, it remains the focus of active research and ongoing debate. The idea suggests that black holes are intimately connected to the expanding universe, and that they could literally be turning matter into dark energy.
Cover Image Credit: ESA/Hubble, NASA, Sloan Digital Sky Survey, Palomar Observatory/California Institute of Technology.
Sources:
A Preferential Growth Channel for Supermassive Black Holes in Elliptical Galaxies at z ≲ 2
Hubble Tension and the G-step Model: Re-examination of Recent Constraints on Modified Local Physics
A Radical Solution to the Hubble Tension Problem
A null test of the Hubble tension
The Hubble Tension and Early Dark Energy
Estimating Hubble Constant with Gravitational Observations: A Concise Review
Estimating Hubble Constant with Gravitational Observations: A Concise Review
Observational Evidence from Supernovae for an Accelerating Universe and a Cosmological Constant
In the Realm of the Hubble tension a Review of Solutions
Hubble distancing: Focusing on distance measurements in cosmology
Hubble Tension or Distance Ladder Crisis?
Constraints on the Hubble constant from supernova Refsdal’s reappearance
TDCOSMO 2025: Cosmological constraints from strong lensing time delays

Leave a comment